- Apr 3
Realtor.com says April 12–18 is the best week to sell in 2026
- Brandon Johnson
- 0 comments
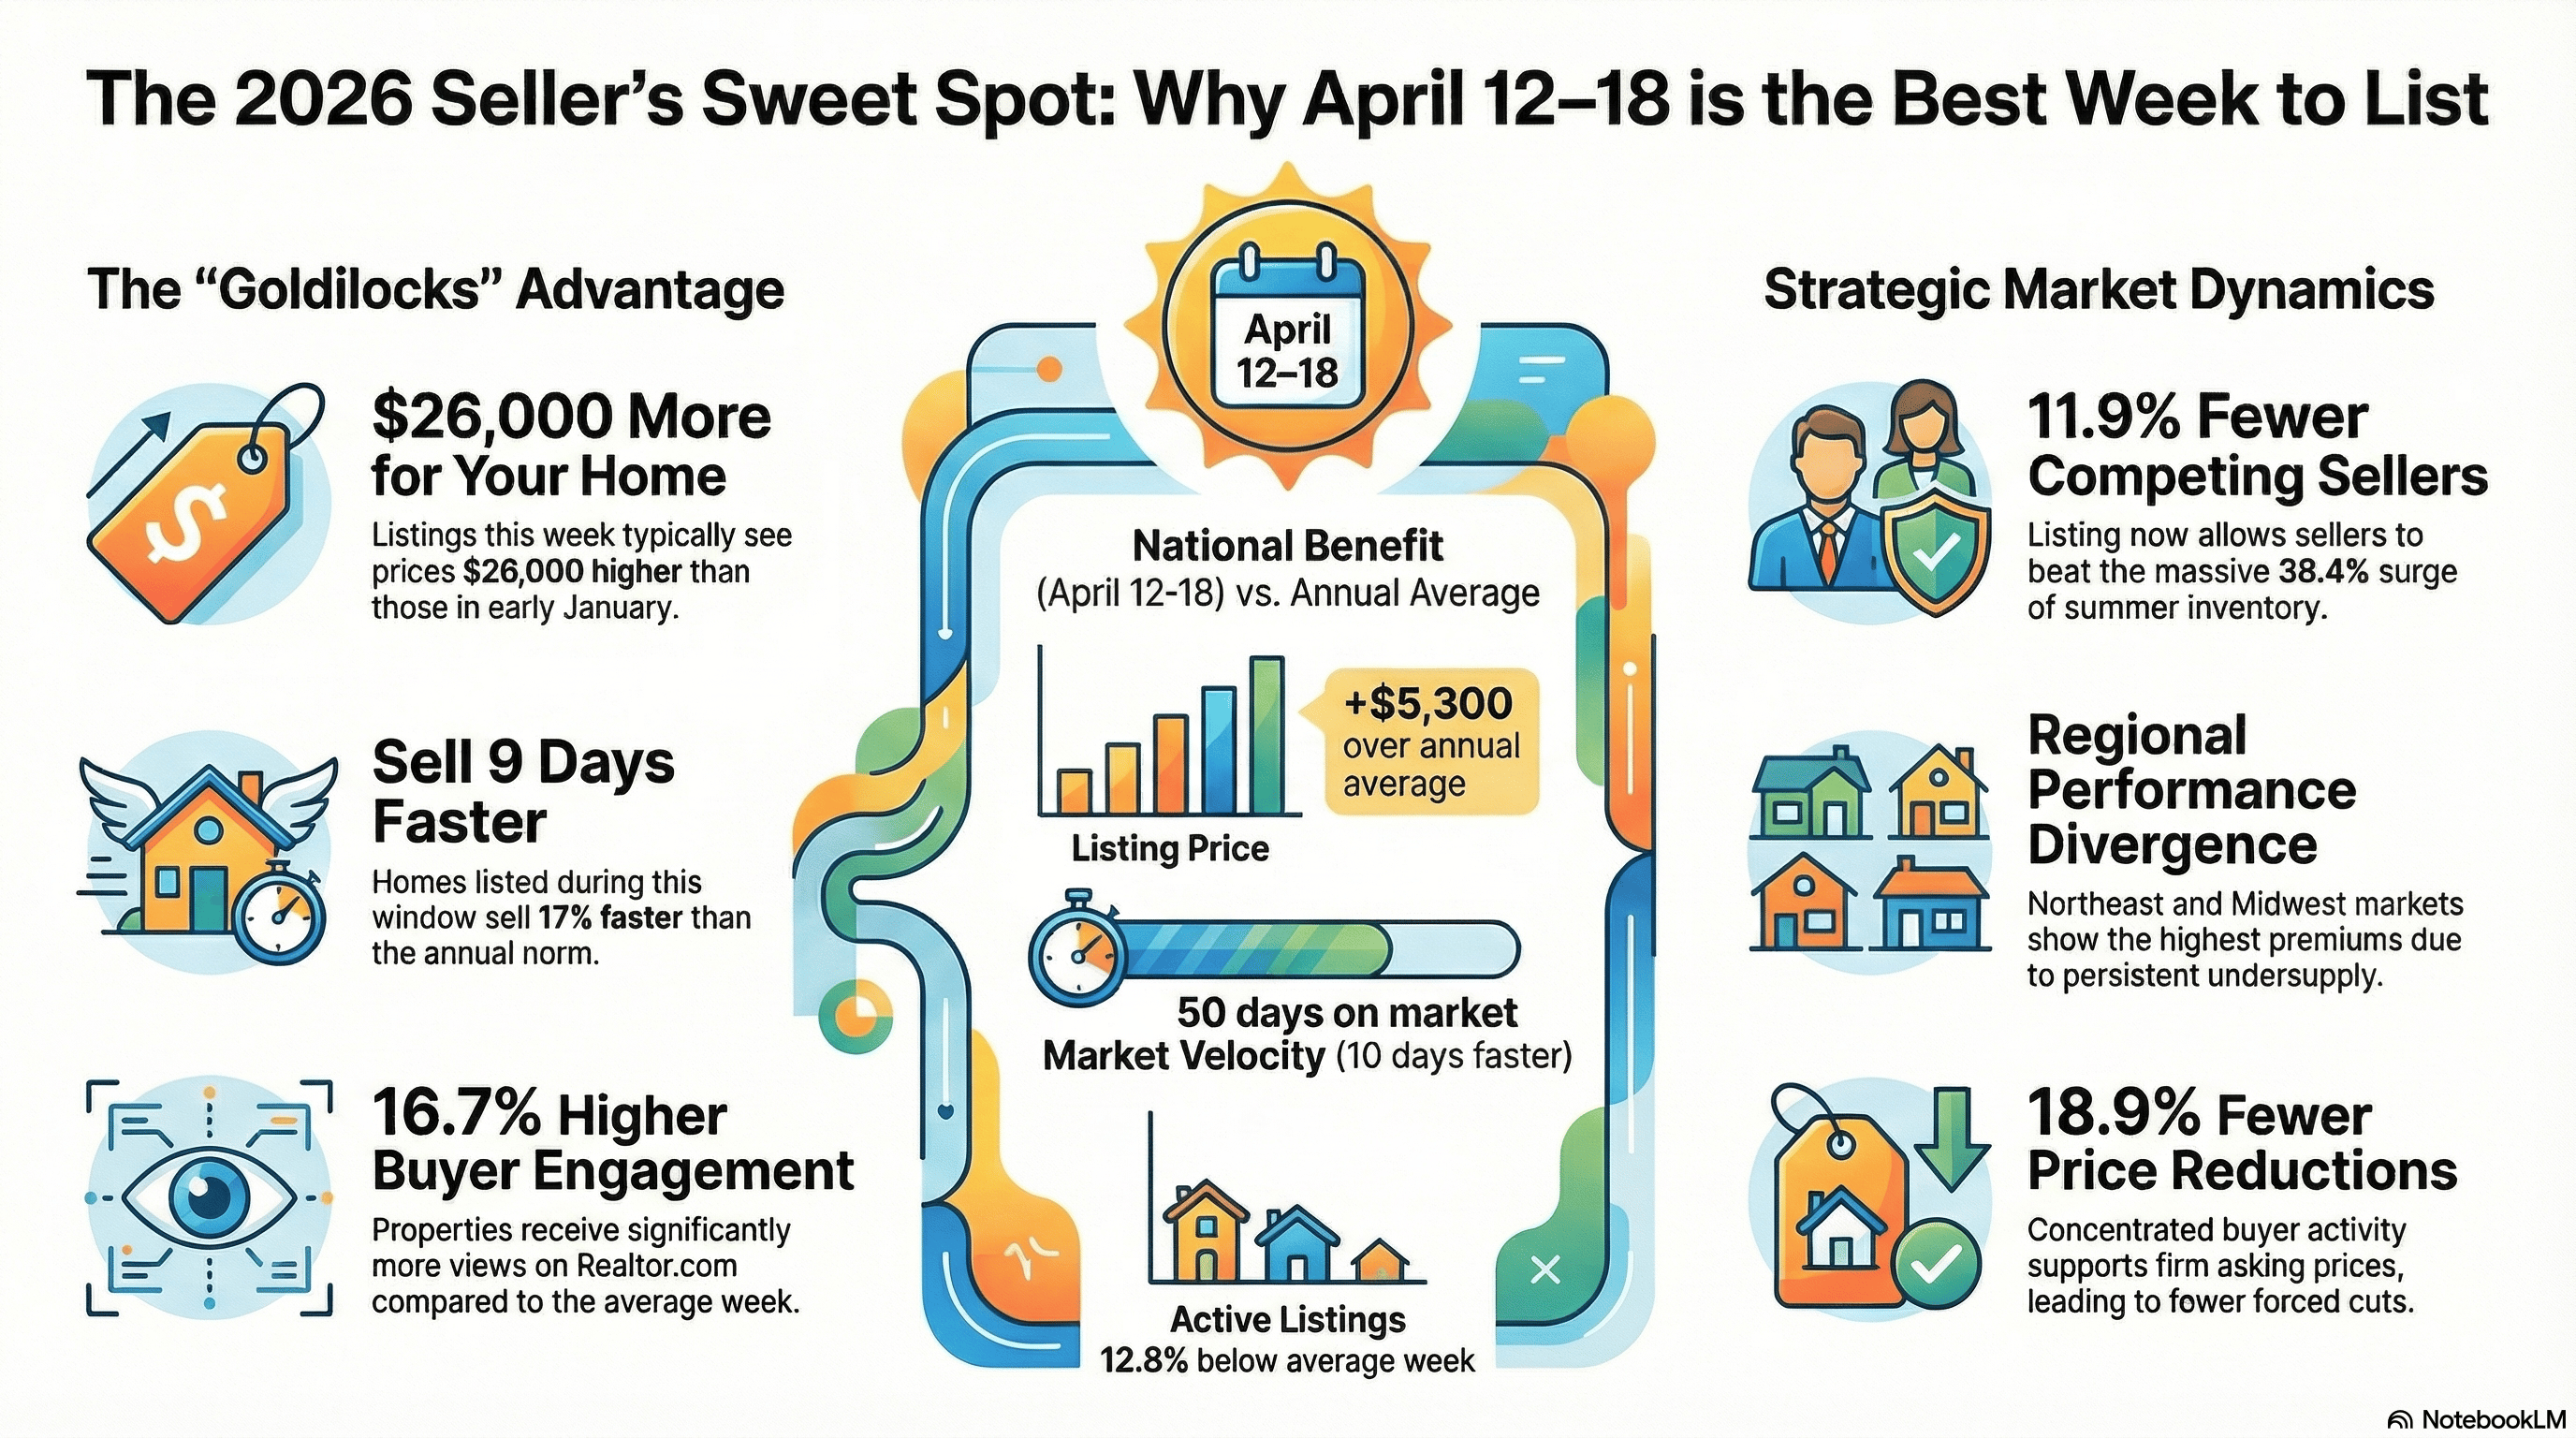
The week of April 12–18, 2026 is the single best time to list a home this year, according to Realtor.com's annual Best Time to Sell report, published March 18, 2026. The analysis identifies a "Goldilocks" window where higher prices, elevated buyer demand, faster sales, and limited seller competition converge to create optimal conditions. Sellers listing during this week could see prices $26,000 higher than January listings and $5,300 above the annual average—while selling nine days faster and facing nearly 19% fewer price reductions than typical weeks. The report arrives at a pivotal moment: mortgage rates briefly touched the 5% range for the first time in 3.5 years in early 2026, pulling sidelined buyers back into the market, but geopolitical instability and rate volatility have since complicated the outlook.

Five data pillars behind the "Goldilocks" window
Realtor.com built its recommendation by analyzing weekly listing metrics from 2018–2019 and 2021–2025 (excluding 2020 as a pandemic anomaly). Each week was scored across multiple seller-favorability metrics, with percentile rankings averaged to produce a composite "Best Time to Sell" score. The five core findings for the April 12–18 window are:
Price premium. Homes listed during this week historically reach prices 1.3% above the average week throughout the year and 6.6% above early January. In dollar terms for 2026, that translates to roughly $5,300 over the annual median and $26,000 more than start-of-year listings. The report explicitly frames this as a listing-price premium, not a sale-price premium, though concentrated buyer activity during this window supports firm asking prices.
Market velocity. In 2025, homes listed during this optimal week spent 50 days on market—10 days faster than the annual average and three days faster than pre-pandemic 2019 levels. Overall, homes sell approximately 17% faster during this window, roughly nine days quicker than the annual norm.
Buyer demand. Listings during this week receive 16.7% more views per property than the average week on Realtor.com. The report attributes this to the seasonal surge of family-oriented buyers motivated to close before the school year, combined with the 2026-specific catalyst of previously sidelined buyers returning as rates eased.
Reduced competition. Mid-April typically sees 11.9% fewer active sellers on the market compared to peak summer months. Nationally, active listings are 12.8% below the average week during this window. This matters because by late June, a 38.4% surge in new seller listings historically floods the market, diluting individual listing visibility even though median prices are near their peak (+11.0% above January in 2025).
Fewer price reductions. Homes listed during this peak week experience 18.9% fewer price reductions (the press release also cites a figure of 20.5% at the national level) compared to the annual average, as concentrated buyer activity supports asking prices.
The regional picture diverges significantly
While the national data points to April 12–18, real estate timing remains deeply local. The report provides best-week data for all 50 largest metro areas, revealing a wide span from early March to late May:
Early-bird markets (March 8–22). High-demand tech and coastal hubs see spring activity ignite much earlier. San Jose (best week: March 8) leads with a staggering $148,000 listing price premium over January and a 32.4% reduction in price cuts. Boston (March 8) shows a $69,000 premium and 46.0% fewer price reductions. Denver (March 8), Seattle (March 29), San Francisco (March 22, $104,000 premium), and Los Angeles (March 22, $73,000 premium) all peak well before mid-April. These markets feature tight inventory, high-intent buyers, and limited winter supply that rewards early listers.
Mid-April markets tracking the national average. Metros like Atlanta, Dallas-Fort Worth, Charlotte, Cleveland, Buffalo, Nashville, Raleigh, and Richmond align with the April 12 national recommendation. The Midwest and Northeast "value" markets—Milwaukee, Grand Rapids, Hartford—also cluster around this window due to relative affordability and extremely limited supply. Buffalo stands out with a 15.2% listing premium and 35.4% more views per property; Cleveland posts a 15.9% premium.
Late-season markets (late April–late May). Several Sun Belt and Southern metros peak later: Phoenix and Tampa (April 19), Indianapolis and Memphis (May 3), Birmingham (May 10), and notably Miami (May 24). Miami's best week shows far more muted advantages—only 3.0% more views, 1.7% fewer price reductions, and just 2 fewer days on market—reflecting its abundant inventory and less pronounced seasonality. Phoenix similarly shows only a 3.1% reduction in price cuts and just 1.4% fewer active listings, signaling a much more competitive seller environment.
Hannah Jones, Realtor.com's senior economic research analyst, stated plainly: "The housing market remains undersupplied, especially in the Northeast and Midwest, meaning sellers of well-priced, move-in ready homes are likely to find success. However, in the South and West where inventory is more abundant, sellers face softer conditions."
Broader 2026 market conditions create a "delicate rebalancing"
The report frames 2026 as a transitional year following a 2025 season where home sales matched nearly three-decade lows. Several dynamics shape the backdrop:
Mortgage rates. Rates stabilized in the low-6% range in late 2025 and briefly touched the 5% range in early 2026—the first time in 3.5 years—before reversing. As of April 2, 2026, the 30-year fixed rate stands at 6.46% (Freddie Mac), up roughly half a percentage point from February lows. Rates have risen for five consecutive weeks, driven by the U.S./Israel-Iran conflict that began February 28, rising oil prices, and tariff-related inflation concerns. The rate path, Realtor.com notes, remains "bumpy," requiring buyers and sellers to "rate-proof" their budgets.
Inventory dynamics. National existing-home inventory reached 1.29 million units in February 2026, up 4.9% year-over-year—the 28th straight monthly gain. Yet supply remains 16.8% below typical 2017–2019 pre-pandemic levels nationally. The critical structural shift: the share of outstanding mortgages above 6% has surpassed those below 3%, gradually easing the "lock-in effect" that froze seller activity for years. New-home inventory is bloated at 9.7 months' supply (476,000 units), with builders offering aggressive rate buydowns to clear stock.
Price growth is decelerating sharply. The NAR median existing-home price of $398,000 in February 2026 represents just 0.3% year-over-year growth—one of the weakest readings since the 2012 recovery. The S&P Case-Shiller 20-City Composite shows only 1.2% annual appreciation, and in inflation-adjusted terms, prices are actually down 2.0% year-over-year. Price forecasts for full-year 2026 range from 0% (J.P. Morgan) to +4% (NAR), with Realtor.com projecting +2.2%.
Affordability is improving. The NAR Housing Affordability Index hit 117.6 in February 2026, the highest since March 2022, after eight consecutive months of improvement. Wage growth is outpacing home price growth by nearly 4 percentage points. About 62.2% of home buyers in 2025 received a discount off the list price, and Redfin advises buyers not to "write off homes slightly above their budget" since concessions are widely available.
Consumer sentiment remains poor. The University of Michigan Consumer Sentiment Index sits at 53.3—in the bottom 1st percentile of the survey's history—reflecting tariff anxieties, geopolitical uncertainty, and general economic unease.
What a real estate professional should note for a response piece
Several elements of this report deserve scrutiny and contextualization in a response:
The methodology scores on listing-price premiums, not sale prices. The 1.3% and $5,300 figures reference what sellers ask, not what buyers ultimately pay. In a market where 62% of buyers received discounts in 2025 and price reductions are common, the gap between listing premium and realized premium matters. The report also benchmarks each week against the first full week of January—a historically slow period—which amplifies the apparent seasonal advantage.
The report was published March 18, before rates spiked. Rates have risen roughly 50 basis points since the February lows, partly unwinding the affordability gains that underpin the report's thesis about sidelined buyers returning. Danielle Hale's framing of a market "starting to feel more approachable" was written when rates were lower; the geopolitical shock from the Iran conflict and ongoing tariff uncertainty have materially changed the rate environment since publication.
The Northeast/Midwest vs. South/West divergence is arguably the report's most actionable insight. Markets like Buffalo (+15.2% listing premium, -37.8% price reductions), Cleveland (+15.9% premium), Cincinnati (+14.7% premium, $50,000 above January), and Detroit (+13.6% premium) show far stronger seasonal advantages than Phoenix (-3.1% price reductions, -1.4% active listings) or Miami (-1.7% price reductions, +3.0% views). For agents in Sun Belt markets, the "best week" advantage is significantly muted.
Zillow disagrees on timing. Zillow's parallel analysis of 2025 home sales found the optimal listing window is the final two weeks of May, not mid-April—with homes selling for 1.7% more (about $6,000) nationally. Zillow Senior Economist Kara Ng attributed this to late-spring momentum when "buyers are eager to move before summer vacations and the new school year." This competing recommendation is worth acknowledging.
The report's broader narrative aligns with what Redfin has called "The Great Housing Reset"—not a crash but a years-long normalization where home prices grow slower than wages for the first time since the Great Recession era. Existing-home sales remain approximately 1 million below pre-pandemic levels despite the economy having added 6 million more jobs since 2019. The structural housing deficit (estimated at 1.2 million to 4+ million homes depending on the source) continues to put a floor under prices even as the market softens. For sellers, the fundamental tension of 2026 is clear: buyers have more options and more leverage than at any point since before the pandemic, but supply still hasn't caught up to long-term demand.
Conclusion
Realtor.com's 2026 Best Time to Sell report delivers a data-rich but nationally focused recommendation that masks significant regional variation. The April 12–18 window is most compelling in supply-starved Midwest and Northeast markets, where seasonal premiums exceed 10–15% above January prices and price reductions plummet. In the Sun Belt, where inventory has returned to pre-pandemic levels, the timing advantage narrows to single-digit margins—and getting ahead of the summer listing surge matters more than capturing a modest price premium. The report's post-publication timing problem—written when rates were dipping toward 5%, now contending with rates back above 6.4%—introduces meaningful uncertainty about whether the demand surge it predicts will fully materialize. For a response piece, the strongest angle may be this: the report is directionally right that early-to-mid spring outperforms summer and winter, but the $26,000 headline figure overstates the advantage by benchmarking against January's seasonal trough, and local market conditions—not national averages—should drive every seller's actual listing strategy.